
실습. 월드컵 데이터 분석해보기
Updated:
역대 월드컵 정보
import pandas as pd
import numpy as np
import matplotlib.pyplot as plt
world_cups = pd.read_csv('WorldCups.csv')
world_cups.keys()
# Index(['Year', 'Country', 'Winner', 'Runners-Up', 'Third', 'Fourth',
#       'GoalsScored', 'QualifiedTeams', 'MatchesPlayed', 'Attendance'],
#      dtype='object')
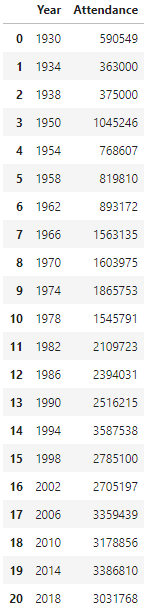
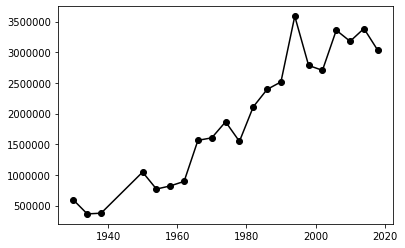
역대 월드컵의 관중 수 출력하기
year_attendance = world_cups[["Year","Attendance"]]
year_attendance
year = year_attendance['Year']
attendance = year_attendance['Attendance']

plt.plot(year, attendance, marker='o', color='black')
plt.show()
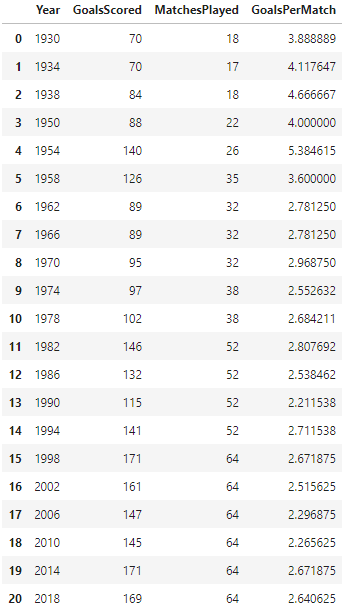
역대 월드컵의 경기당 득점 수
world_cups.keys()
# Index(['Year', 'Country', 'Winner', 'Runners-Up', 'Third', 'Fourth',
#       'GoalsScored', 'QualifiedTeams', 'MatchesPlayed', 'Attendance'],
#      dtype='object')
GoalsPerMatch = world_cups[["Year","GoalsScored","MatchesPlayed"]]
GoalsPerMatch["GoalsPerMatch"] = world_cups["GoalsScored"]/world_cups["MatchesPlayed"]
GoalsPerMatch
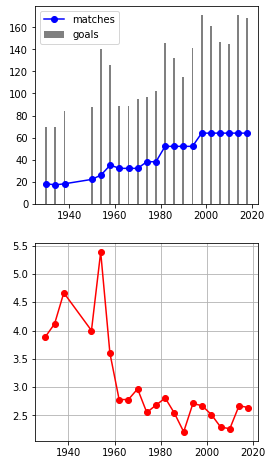
fig, axes = plt.subplots(2, 1, figsize = [4,8])
axes[0].bar(x=GoalsPerMatch['Year'], height=GoalsPerMatch['GoalsScored'], color='grey', label='goals')
axes[0].plot(GoalsPerMatch['Year'],GoalsPerMatch['MatchesPlayed'], marker='o',color='blue', label='matches')
axes[0].legend(loc='upper left')

axes[1].grid(True)
axes[1].plot(GoalsPerMatch['Year'], GoalsPerMatch['GoalsPerMatch'], marker='o', color='red', label='goals_per_matches')
월드컵 매치 정보
월드컵 매치 데이터
world_cups_matches = pd.read_csv("WorldCupMatches.csv")
world_cups_matches = world_cups_matches.replace('Germany FR','Germany').replace("C�te d'Ivoire","Côte d'Ivoire").replace('rn”>Bosnia and Herzegovina','Bosnia and Herzegovina').replace('rn”>Serbia and Montenegro','Serbia and Montenegro').replace('rn”>Trinidad and Tobago','Trinidad and Tobago').replace('rn”>United Arab Emirates','United Arab Emirates	').replace('Soviet Union','Russia')
# 잘못된 정보 변경

dupli = world_cups_matches.duplicated()
print(len(dupli[dupli==True]))
# 16
# 중복데이터 확인

world_cups_matches = world_cups_matches.drop_duplicates()
dupli = world_cups_matches.duplicated()
print(len(dupli[dupli==True]))
# 0
# 중복데이터 제거 확인
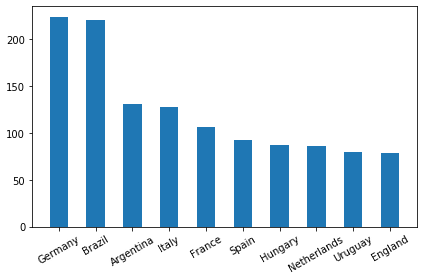
국가별 득점 수 구하기
world_cups_matches.keys()
# Index(['Year', 'Datetime', 'Stage', 'Stadium', 'City', 'Home Team Name',
#       'Home Team Goals', 'Away Team Goals', 'Away Team Name',
#       'Win conditions', 'Attendance', 'Half-time Home Goals',
#       'Half-time Away Goals', 'Referee', 'Assistant 1', 'Assistant 2',
#       'RoundID', 'MatchID', 'Home Team Initials', 'Away Team Initials'],
#      dtype='object')
home = world_cups_matches.groupby(['Home Team Name'])["Home Team Goals"].sum()
away = world_cups_matches.groupby(['Away Team Name'])["Away Team Goals"].sum()

goal_per_country = pd.concat([home, away], axis=1, sort=True).fillna(0)
# home과 away를 열을 기준으로 합치고 결측치를 모두 0으로 초기화

goal_per_country['Goals'] = goal_per_country['Home Team Goals'] + goal_per_country['Away Team Goals']
# Home Team Goals와 Away Team Goals를 이용해서 총 수 구하기

goal_per_country = goal_per_country["Goals"].sort_values(ascending = False)
# Goals을 기준을 내림차순 정렬

goal_per_country = goal_per_country.astype(int)
# 값을 정수형으로 변경

goal_per_country
# Germany                    224
# Brazil                     221
# Argentina                  131
# Italy                      128
# France                     106
                          ...
# Zaire                        0
# Canada                       0
# rn">Trinidad and Tobago      0
# Dutch East Indies            0
# China PR                     0
# Name: Goals, Length: 81, dtype: int32
goal_per_country = goal_per_country[:10]
country = goal_per_country.index
goals = goal_per_country.values
fig, ax = plt.subplots()

ax.bar(country, goals, width = 0.5)
# 막대기의 width를 원래의 50%로 조정

plt.xticks(country, rotation=30)
# 반시계 방향으로 30도 회전

plt.tight_layout()
# 글자가 넘쳐서 잘리는 현상을 방지
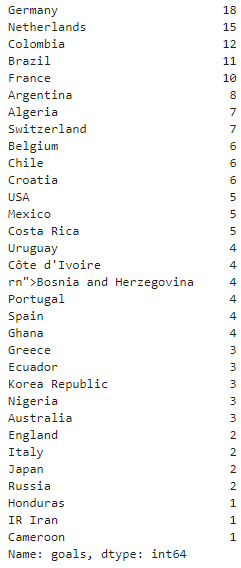
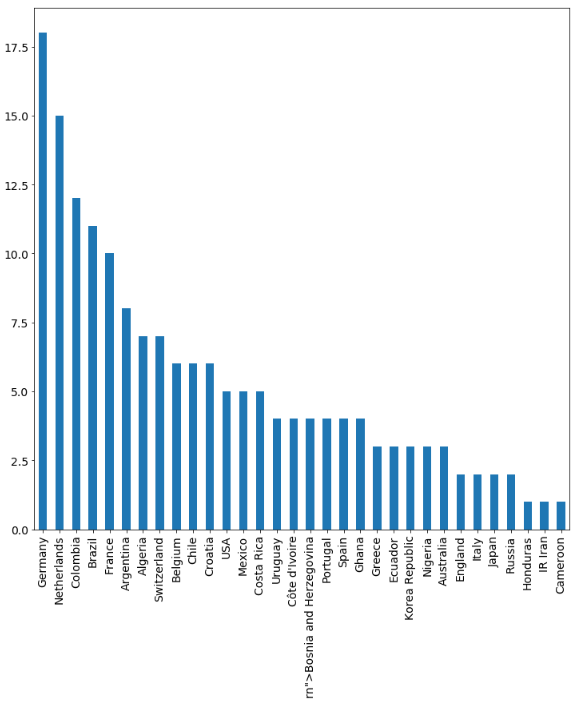
2014 월드컵 다득점 국가 순위
world_cups_matches =world_cups_matches[world_cups_matches['Year']==2014]
home_team_goal = world_cups_matches.groupby(['Home Team Name'])['Home Team Goals'].sum()
Away_team_goal = world_cups_matches.groupby(['Away Team Name'])['Away Team Goals'].sum()

team_goal_2014 = pd.concat([home_team_goal,Away_team_goal],axis = 1).fillna(0)

team_goal_2014['goals'] = team_goal_2014['Home Team Goals'] + team_goal_2014['Away Team Goals']
team_goal_2014 = team_goal_2014.drop(['Home Team Goals', 'Away Team Goals'], axis=1)

team_goal_2014.astype('int')

team_goal_2014 = team_goal_2014['goals'].sort_values(ascending=False)

team_goal_2014
team_goal_2014.plot(x=team_goal_2014.index, y=team_goal_2014.values, kind="bar", figsize=(12, 12), fontsize=14)
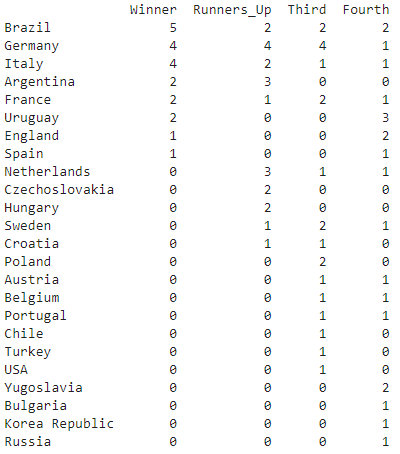
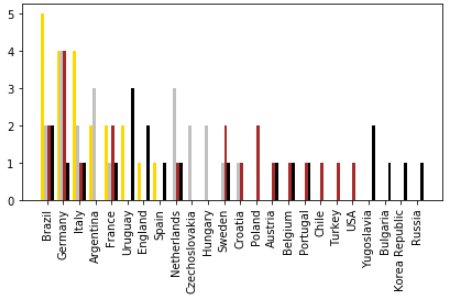
월드컵 4강 이상 성적 집계하기
world_cups = pd.read_csv("WorldCups.csv")


winner = world_cups["Winner"]
runners_up = world_cups["Runners-Up"]
third = world_cups["Third"]
fourth = world_cups["Fourth"]

winner_count = pd.Series(winner.value_counts())
runners_up_count = pd.Series(runners_up.value_counts())
third_count = pd.Series(third.value_counts())
fourth_count = pd.Series(fourth.value_counts())

ranks = pd.DataFrame({
  "Winner" : winner_count,
  "Runners_Up" : runners_up_count,
  "Third" : third_count,
  "Fourth" : fourth_count
})

ranks = ranks.fillna(0).astype('int64')

ranks = ranks.sort_values(['Winner', 'Runners_Up', 'Third', 'Fourth'], ascending=False)

print(ranks)
x = np.array(list(range(0, len(ranks))))

# 그래프를 그립니다.
fig, ax = plt.subplots()

# x 위치에, 항목 이름으로 ranks.index(국가명)을 붙입니다.
plt.xticks(x, ranks.index, rotation=90)
plt.tight_layout()

# 4개의 막대를 차례대로 그립니다.
ax.bar(x - 0.3, ranks['Winner'],     color = 'gold',   width = 0.2, label = 'Winner')
ax.bar(x - 0.1, ranks['Runners_Up'], color = 'silver', width = 0.2, label = 'Runners_Up')
ax.bar(x + 0.1, ranks['Third'],      color = 'brown',  width = 0.2, label = 'Third')
ax.bar(x + 0.3, ranks['Fourth'],     color = 'black',  width = 0.2, label = 'Fourth')
Leave a comment