
데이터시각화_기본
Updated:
import numpy as np
import matplotlib.pyplot as plt
import pandas as pd
from pandas import DataFrame, Series
from numpy.random import randn
차트 한글
# Windows
from matplotlib import font_manager, rc

font_name = font_manager.FontProperties(fname="c:/Windows/Fonts/malgun.ttf").get_name()
rc('font', family=font_name)
from matplotlib import rc
rc('font', family='Malgun Gothic')
차트
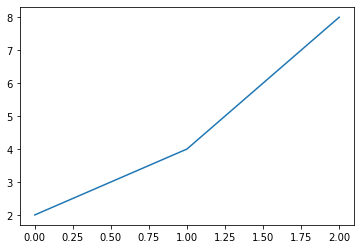
y = [2,4,8]
plt.plot(y)
plt.show()
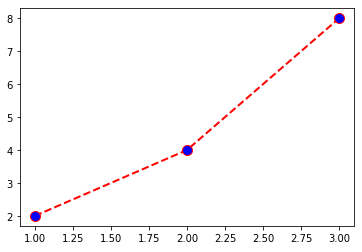
x = [1,2,3]
y = [2,4,8]

plt.plot(x,y, ls = '--', marker = 'o', lw = '2', color = 'r', mfc = 'B', ms = 11)
plt.show()
Lime style
| Character | Description |
|---|---|
| ‘ - ’ | Solid line style |
| ‘ – ’ | Dashed line style |
| ‘ -. ’ | Dash-dot lint style |
| ‘ : ’ | Dotted line style |
Marker
| Character | Description | Character | Description | |
|---|---|---|---|---|
| ‘ . ’ | Point marker | ‘ 1 ’ | Tri_down marker | |
| ‘ o ’ | Circle marker | ‘ 2 ’ | Tri_up marker | |
| ‘ v ’ | Triangle_down marker | ‘ 3 ’ | Tri_left marker | |
| ‘ ^ ’ | Triangle_up marker | ‘ 4 ’ | Tri_right marker | |
| ‘ < ‘ | Triangle_left marker | ‘ * ‘ | Star marker | |
| ‘ > ‘ | Triangle_right marker | ‘ h ‘, ‘ H ’ | Hexagon1,2 marker | |
| ‘ s ‘ | Square marker | ‘ + ‘ | Plus marker | |
| ‘ p ‘ | Pentagon marker | ‘ D ‘ | Diamond marker | |
| ‘ | ‘ | Vline marker | ‘ _ ‘ | Hline marker |
Line color
| Character | Color | Character | Color |
|---|---|---|---|
| ‘ b ’ | Blue | ‘ m ‘ | Magenta |
| ‘ g ’ | Green | ‘ y ‘ | yellow |
| ‘ r ‘ | Red | ‘ k ‘ | Black |
| ‘ c ‘ | cyan | ‘ w ‘ | white |
Style option
| 스타일옵션종류 | 설명 | 약자 |
|---|---|---|
| color | 선 색깔 | c |
| linewidth | 선 굵기 | lw |
| linestyle | 선 스타일 | ls |
| marker | 마커 종류 | |
| markersize | 마커 크기 | ms |
| markeredgecolor | 마커 선 색깔 | mec |
| markeredgewidth | 마커 선 굵기 | mew |
| markerfacecolor | 마커 내부 색깔 | mfc |
x = np.arange(7)
y = [1,4,5,8,9,5,3]
plt.xlim(-2,10)
plt.ylim(-5,12)
# 차트의 범위를 수동으로 지정

plt.xticks([-2,0,3,6,10])
plt.yticks([-5,1,5,9,12])
# 축상의 수동으로 위치 표시

plt.grid()
# 격자 눈금

plt.plot(x, y)
plt.show()
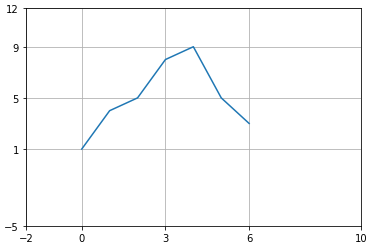
차트 옵션
| plot | 옵션 정의 |
|---|---|
| xlim, ylim | x 축 범위, y축 범위 |
| grid | 격자눈금 |
| legend | 범례 |
| xlabel, ylabel | x축 타이틀, y축 타이틀 |
| title | 그래프 제목 |
| xticks, yticks | x축 눈금 조정, y축 눈금 조정 |
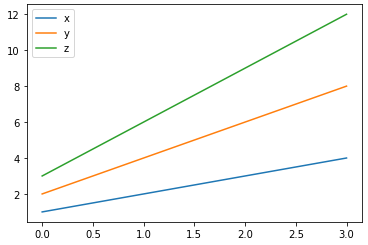
여러 개 플롯
x = [1,2,3,4]
y = [2,4,6,8]
z = [3,6,9,12]
plt.plot(x, label='x')
plt.plot(y, label='y')
plt.plot(z, label='z')

plt.legend()
plt.show()
Leave a comment